Tag: Cost of Living

  • How Oil Prices Affect Your Wallet in Alberta in 2025 so far

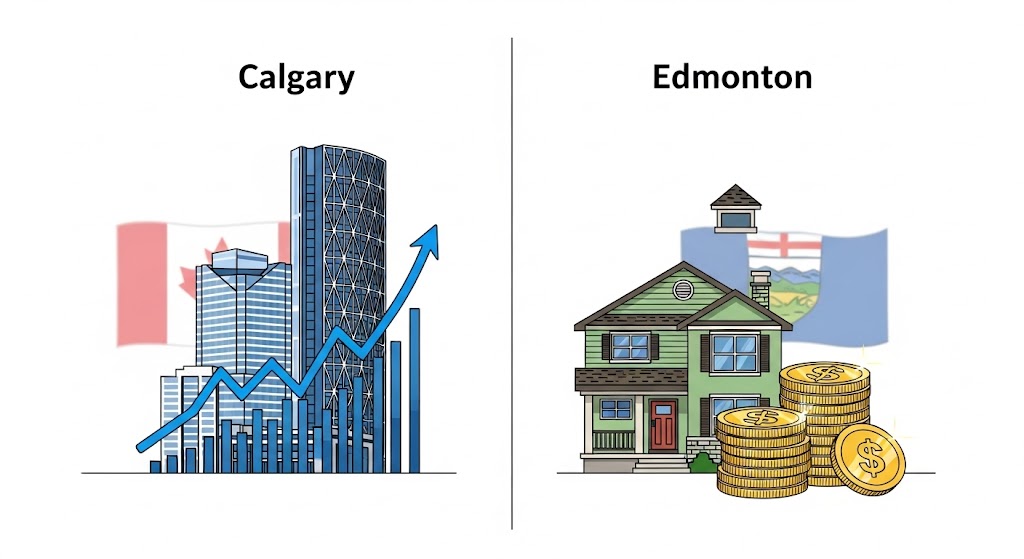
    1. Introduction & Executive Overview

    Alberta’s economy is defined by its deep connection to the global crude oil market, serving as Canada’s largest producer. This link means global commodity price fluctuations directly impact provincial finances, energy investment, and, critically, the day-to-day budgets of residents.

    Why 2025 oil prices matter: The year 2025 marks a crucial economic pivot. Oil price moderation is weakening the provincial government’s resource revenues ($1.4 billion shortfall in Q1 2025), but a historically massive 2.5% population influx is fueling resilient growth in construction, retail, and services. The resulting economic narrative is complex, characterized by both strong job creation and budgetary caution.

    Current Pricing Context: Q3–Q4 2025 Snapshot

    Oil prices moderated in 2025 due to strong non-OPEC+ supply. Alberta’s revenue is determined by Western Canadian Select (WCS), which trades at a discount (the differential) to the global benchmark, West Texas Intermediate (WTI).

    BenchmarkQ3 2025 Average (Approx.)Full-Year 2025 Forecast
    West Texas Intermediate (WTI)US$65.07 / bblUS$66.00 / bbl
    Western Canadian Select (WCS)US$52.52 / bblUS$55.00 / bbl

    Lower oil = cheaper gas but lower government revenue

    The core impact on the Albertan wallet is a trade-off: lower fuel costs provide minor relief, but this is overwhelmed by persistent structural inflation in housing and groceries driven by record population growth.

    2. Alberta’s Oil-Driven Economic Structure

    Alberta produces over 80% of Canada’s oil, holding vast oil sands reserves. The province’s economic DNA is highly sensitive to commodity cycles, with the energy sector historically contributing 15% to 20% of the provincial GDP. The provincial government’s budget remains heavily reliant on royalties from these resources. The low-to-moderate WCS price environment in 2025 means that new, high-cost oil sands expansion is suppressed, shifting the energy sector’s focus to efficiency, technology, and share buybacks rather than broad capital expenditure (capex) growth.

    3. How Oil Prices Shape Personal Finances

    3.1 Employment and Income

    Alberta’s labour market in late 2025 is paradoxical: it shows robust net job gains driven by population expansion, yet maintains a significantly elevated unemployment rate (7.8% in September 2025). The market is struggling to absorb the sheer volume of newcomers.

    • Hiring Trends: Major energy hiring focuses on specialized roles (data science, clean-tech, optimization engineers). Job creation for general labour is concentrated in population-driven sectors like construction, manufacturing, and retail.
    • Wage Competitiveness: Alberta’s high average weekly earnings, sustained by specialized energy and utility roles, remain a key advantage, especially when combined with the lack of Provincial Sales Tax (PST).

    3.2 Cost of Living Implications

    • Gasoline: The moderation of WCS prices and the provincial carbon levy removal led to a 4.1% year-over-year decline in gasoline prices in September 2025, offering tangible relief at the pump.
    • Housing: The high cost of shelter is the primary pressure point. The purchase market for high-end detached homes is softening (Calgary benchmark fell 4% YoY to $572,800) due to high interest rates, but the rental market remains critically tight and inflated due to population influx. Edmonton’s average rent slightly cooled to $1,573, but affordability pressure for new arrivals is intense.
    • Taxation Benefits: Alberta maintains a unique competitive edge as the only Canadian province without a PST, providing greater take-home purchasing power than British Columbia or Ontario.

    3.3 Practical Budget Scenarios

    All budgets must balance the tax advantage against high shelter costs:

    • Individual Worker: Benefits from high salary potential and no PST. Primary challenge is securing employment amidst the 7.8% unemployment environment and managing the high initial cost of rent.
    • Young Family: Benefits from lower overall income tax (new 8% rate for incomes under $60,000) and lower single-family home prices compared to Vancouver/Toronto. Budget strain comes from grocery costs (4.0% YoY rise) and high utility/insurance costs (11.9% YoY rise in home insurance).

    4. Government Services and Fiscal Stability

    Royalty revenues and provincial budget outcomes in 2025

    The resource royalty system is highly sensitive to WCS prices. The moderation near $55/bbl resulted in a $1.4 billion resource revenue shortfall against projections in Q1 2025. This fiscal constraint limits the government’s ability to aggressively fund public services to meet the demands of the 5.0 million person population.

    • Impacts on Services: The revenue shortfall creates pressure points in healthcare funding and education, where rapidly expanding student populations require significant capital investment in new schools. Infrastructure spending is being maintained as a counter-cyclical economic stimulus.

    Alberta Heritage Fund: value, use, debate

    The Alberta Heritage Savings Trust Fund (AHSTF) was established to save a portion of resource revenue. Its fair value as of June 30, 2025, was $27.6 billion, having received a $2.8 billion surplus deposit. The fund is aiming for $250 billion by 2050 to stabilize future budgets, but this goal highlights the historical failure to save adequately during previous oil booms.

    5. Real Estate and Migration Patterns

    Relationship between oil cycles and home prices

    The traditional correlation between high oil prices and an overheating housing market has been disrupted. In 2025, population growth and high interest rates are the main drivers. The massive influx of new residents maintains demand pressure, particularly at the entry level, even as high interest rates slow the high-end purchase market.

    Rent vs. Buy Considerations for New Arrivals

    Given the high interest rate environment (2.50% Bank of Canada rate) and the labour market’s absorption challenge, renting for the first 6–12 months is strongly advised for new arrivals. Renting provides flexibility and avoids locking into high mortgage costs while employment is stabilized. Rental properties, despite the high cost, offer robust cash flow for investors due to critically low vacancy rates.

    6. Business Climate and Economic Diversification

    Corporate tax advantages and labour market realities

    Alberta maintains a supportive corporate tax environment, making it attractive to business owners (including foreign-incorporated entities like the reader’s). The large and growing 5.0 million person consumer base creates vast opportunity. However, businesses face cautious consumer spending (shift to necessity-driven expenditures) and elevated operational costs due to national inflation.

    Industry opportunities

    • Energy services: Focused on optimization, maintenance, and short-cycle projects, leveraging AI and technology.
    • Construction and development: A boom sector driven by housing starts and public infrastructure.
    • Retail and Hospitality: Directly benefiting from the growing population and consumer demand.
    • Technology: Key diversification target, with strong growth in Calgary’s fintech and agritech sectors.

    Province-led transition initiatives beyond fossil fuels

    The government is prioritizing diversification through targeted incentives for non-energy businesses. Long-term prosperity hinges on successfully transitioning the province’s energy expertise into low-carbon technologies like CCUS and hydrogen, though regulatory uncertainty (e.g., around TIER reforms) poses a risk to multi-billion dollar clean energy projects.

    7. Investor & Business Considerations

    7.1 Individuals

    • Portfolio Exposure: Energy stocks should be balanced, focusing on integrated companies with strong balance sheets that prioritize capital return rather than high-risk, long-horizon growth projects.
    • Real Estate: Focus on multi-family residential rental units for cash flow, as this segment benefits most from the population boom.
    • CAD Currency Correlation: The Canadian dollar (CAD) retains a historical link to oil. As WTI/WCS prices moderated in 2025, the CAD often showed weakness, which international investors must account for with hedging strategies.

    7.2 Business & Foreign Investors

    • Market Entry Timing: Optimal timing for businesses serving the essential needs of the growing population (e.g., healthcare technology, efficient logistics, professional services) rather than those tied to speculative oil capex.
    • Operational Resilience: For the Australian-based owner, focus on contracts and consumer bases that are not directly tied to the oil and gas field services spending to mitigate WCS price volatility. Leverage the corporate tax advantage while maintaining strict cash flow management against high national interest rates.

    8. Outlook for 2025 and Beyond

    Short-term global supply/demand drivers

    Short-term forecasts suggest WTI prices will continue to moderate toward $62/bbl in Q4 2025 and decline further to $52/bbl in H1 2026. This implies continued fiscal constraint for the provincial government and greater reliance on the economic momentum generated by population growth.

    Longer-term energy transition influences

    The long-term goal of decarbonization fundamentally limits the prospect of another unrestrained, long-term oil boom, forcing the energy sector to specialize and automate. Alberta’s future rests on its success in transitioning its energy expertise to low-carbon technologies.

    Key uncertainties and potential economic shocks

    Major uncertainties include global geopolitical events affecting supply, future OPEC+ production decisions, and the risk of an economic recession tied to persistent global interest rate hikes. Domestically, the federal-provincial climate policy dynamic (TIER regulations) remains a major wild card for long-term investment.

    9. Practical Guidance by Reader Type

    • New Residents: Target specialized technical jobs or those in population-driven sectors. Ensure a financial buffer of 4–6 months of living expenses due to high rent and the 7.8% unemployment absorption challenge.
    • Current Residents: Upskill in trades or digital literacy, as the energy sector’s labour demand is rapidly specializing. Use the relief from lower fuel costs to aggressively pay down high-interest consumer debt.
    • Investors: Balance energy exposure with allocations to the logistics, manufacturing, and technology clusters. Focus on assets driven by the 5.0 million person consumer base.
    • Business Owners: Focus on efficiency, maintain strict cash flow management, and diversify the customer base away from sole reliance on oil and gas capex.

    10. Conclusion & Key Insights

    Summary of the relationship between oil prices and daily life

    The Alberta economy in 2025 is defined by a dichotomy: the Oil Price Risk (external commodity volatility, constraining public funds) versus the Population Demand Advantage (internal demographic resilience, driving job creation and housing costs).

    How to make informed decisions in Alberta’s resource-linked economy

    All financial decisions should balance this dichotomy. If your career or business is population-dependent (construction, retail, tech), the outlook remains strong. If it relies purely on aggressive, high-cost oil capex, caution is required. The path to long-term success in Alberta is one of diversification and resilience.

    Recommendations for further information and monitoring

    Monitor the Alberta Economic Dashboard for monthly WCS prices and the Labour Force Survey for the unemployment rate and job creation trends. Pay close attention to the Bank of Canada’s policy rate for future impact on all forms of financing.

    External Source Links and Data Portals

    This article leverages data and forecasts from the following authoritative public and private sector organizations. The links provided direct you to the main data portal or report landing page for each source, where the specific Q3-Q4 2025 reports were accessed.

    Government & Official Statistics

    Economic Forecasts & Financial Institutions

    Urban & Commercial Market Data

    Rentals.ca Data: Edmonton Average Rent, Rental Market Conditions, Affordability Pressure

  • Cost of Living in Calgary vs Edmonton, Canada: The Definitive Comparison

    Cost of Living in Calgary vs Edmonton, Canada: The Definitive Comparison

    1. Executive Summary

    1.1 Key Takeaways

    FactorCalgary (The Hub)Edmonton (The Capital)Key Difference
    Benchmark Home Price (SFD)Approx. $700,000Approx. $500,000Calgary is 40% higher
    Average Rent (1-BR, Unfurnished)Approx. $1,613/monthApprox. $1,339/monthEdmonton is ~$275/month cheaper
    Total Monthly CoL (Single Person)Approx. $1,881 (excluding rent)Approx. $1,692 (excluding rent)Calgary is 11% higher
    Median Income (City-wide)$63,700$57,000Calgary is 12% higher
    Property Tax Rate (Residential)Lower Mill Rate (0.66%)Higher Mill Rate (Approx. 1.01%)Edmonton property taxes are higher on the same-valued home
    Commuter Cost (Monthly Transit)$115.00 (Calgary Transit)$102.00 (ETS Arc Cap)Edmonton is $13 cheaper
    Economic IdentityCorporate, Finance, Technology, Energy HQGovernment, Public Sector, Education, ManufacturingCalgary offers higher income potential, Edmonton offers stability

    Overall cost comparison snapshot: Edmonton is consistently the more affordable city on nearly every metric, driven primarily by significantly lower housing costs. However, Calgary offers a higher median income, which partially offsets the increased expenses, creating a compelling affordability trade-off that depends on one’s career and housing goals.

    Who benefits from each city:

    • Calgary: High-earning professionals, those in the corporate finance or tech sectors, and investors seeking higher property value appreciation.
    • Edmonton: First-time homebuyers, young families, public sector employees, students, and those prioritizing monthly savings over peak income.

    Quick decision framework for readers: Choose Calgary if your job salary is significantly higher than Edmonton’s average and you are comfortable renting or entering a competitive housing market. Choose Edmonton if maximizing disposable income, prioritizing homeownership, or seeking a stable public/education sector job is your goal.

    1.2 Article Purpose and Scope

    This guide provides a detailed, data-driven comparison of the cost of living between Alberta’s two major metropolitan areas: Calgary and Edmonton. Our analysis utilizes recent data from 2024 and 2025, drawing on official sources (Statistics Canada, municipal reports) and industry reports (CREA, Numbeo, insurance aggregators) to move beyond anecdotal comparisons.

    This comparison is intended for three key audiences:

    1. People considering moving to Alberta (inter-provincial and international migrants) who need to make an informed decision on relocation based on tangible costs and career prospects.
    2. Investors and Business Owners who require a clear understanding of regional differences in commercial property costs, talent wages, and overall operational expenditure.
    3. Curious Residents who wish to benchmark their current expenses against the alternative major metropolitan area in the province.

    The analysis is structured to cover the most critical budget items—housing, income, and taxation—before diving into daily expenditures like transportation, utilities, and lifestyle.

    2. Introduction: Understanding Alberta’s Two Major Cities

    Calgary and Edmonton, often referred to as twin cities, anchor the high-growth Calgary-Edmonton Corridor. While only three hours apart, they possess distinct economic profiles and cultural identities that heavily influence their cost of living and earning potential.

    2.1 Calgary Overview

    Calgary is Alberta’s largest city and economic engine, often seen as the gateway to the Rocky Mountains.

    • Economic Profile: Historically reliant on the oil and gas sector (O&G headquarters), Calgary has diversified rapidly, establishing itself as a major national hub for corporate finance, head offices, and a burgeoning tech industry.
    • Cultural Identity: Characterized by its entrepreneurial spirit, modern skyline, and the famous Calgary Stampede. It has a fast-paced, competitive, and business-oriented culture.

    2.2 Edmonton Overview

    Edmonton is the provincial capital, situated further north, famous for its deep river valley parks and the massive West Edmonton Mall.

    • Economic Profile: Edmonton’s economy is defined by stability, supported by its role as the seat of the provincial government, a strong public sector, major research universities (University of Alberta), and significant manufacturing and refining operations.
    • Cultural Identity: Often described as a city with a tight-knit, grounded, and public-facing culture, thriving on arts, festivals (the “Festival City”), and community programming.

    2.3 Why This Comparison Matters

    The comparison is vital because while Alberta offers the unique advantage of no Provincial Sales Tax (PST), the difference in municipal and regional costs between Calgary and Edmonton can be greater than the provincial savings enjoyed over other parts of Canada. Since your business is incorporated in Alberta, understanding the specific talent pool and operating costs in the two major CMAs is critical for future scaling and resource management.

    3. Housing Costs: The Biggest Budget Factor

    Housing is the single largest differentiator in the cost of living between the two cities.

    3.1 Home Purchase Prices

    In the dynamic 2024-2025 Alberta market, Calgary has solidified its position as the more expensive city for homeownership due to acute supply shortages and high migration.

    3.1.1 Average Home Prices by Type (2024/2025 Data)

    The latest benchmark data shows a substantial price gap, especially for detached homes, which are highly sought after by inter-provincial migrants.

    Property Type (Benchmark HPI)Calgary PriceEdmonton PricePrice Difference
    Single-Family Detached~$700,000$~$500,000$~$200,000$
    Total Benchmark Price~$583,100$~$399,300$~$183,800$
    CondominiumsRising RapidlyMore StableCalgary is still significantly higher

    The benchmark price for a typical home in Calgary is approximately 46% higher than in Edmonton. This difference is partially driven by Calgary’s tighter sales-to-new-listings ratio, making it a much more competitive seller’s market, especially for detached and semi-detached properties.

    3.1.2 Neighborhood Price Variations

    Both cities follow the Canadian trend of premium inner-city neighborhoods commanding high prices.

    • Calgary: Luxury neighborhoods like Mount Royal, Elbow Park, and Aspen Woods push the average up. More affordable options are found further from the core in the deep South (Cranston, Auburn Bay) and Northeast quadrants.
    • Edmonton: High-value areas are typically near the River Valley and prestigious areas like Glenora and Laurier Heights. More affordable homes are found in the North and some peripheral communities, providing a better entry point for first-time buyers.

    3.1.3 Market Trends and Forecasts

    Both markets saw strong growth in 2024, but Calgary’s growth was driven by inter-provincial migration and tight supply, while Edmonton’s growth was more balanced. Housing starts per capita have been strong in both, but Edmonton has seen a higher proportion of purpose-built rental starts (20.0 per 10,000 population) compared to Calgary (13.7), which may help stabilize future rental prices in the capital. Forecasts suggest Calgary prices will continue to outpace Edmonton due to demand dynamics.

    3.2 Rental Market Analysis

    The disparity in rental costs mirrors the disparity in home prices, providing Edmonton with a significant advantage for those who choose not to buy immediately.

    3.2.1 Average Rental Rates (2024 Data)

    Rental costs are the most immediate difference felt by newcomers.

    Unit Type (Unfurnished, Asking Price)Calgary AverageEdmonton AverageMonthly Savings in Edmonton
    1-Bedroom Apartment~$1,613$~$1,339$~ $274
    2-Bedroom Apartment~$2,150$~$1,650$~ $500

    For a new renter, choosing Edmonton can save a household between $3,000$ and $6,000$ annually on housing alone.

    3.2.2 Rental Market Dynamics

    While Calgary has historically had higher vacancy rates due to O&G cycles, recent high migration has driven vacancy rates lower than Edmonton. This leads to higher competition and less negotiating power for renters in Calgary.

    3.3 Additional Housing Costs

    • Property Taxes Comparison: While Edmonton’s home prices are lower, its residential municipal tax rate (mill rate) is often significantly higher than Calgary’s. For a homeowner in Edmonton, a comparable home assessment will typically result in a much higher annual property tax bill, with Calgary’s rate being one of the lowest among major Canadian cities.
    • Utilities (see Section 4.1): Utility costs are highly variable, but Calgary’s electricity rates have historically been slightly cheaper for residential customers, while Edmonton’s distribution charges (EPCOR) may differ from Calgary’s (ENMAX).

    4. Utilities and Essential Services

    Alberta’s deregulated energy market means prices for natural gas and electricity commodities are provincial. However, the fixed distribution and transmission charges, which are set by local distributors (ENMAX in Calgary, EPCOR in Edmonton), can differ.

    4.1 Energy Costs

    4.1.1 Electricity and Natural Gas

    Based on 2024 data, Calgary’s residential electricity price (in ¢/kWh) was found to be slightly lower than Edmonton’s. However, the total bill for a typical residential customer is heavily influenced by the delivery and transmission charges, which vary.

    • Average Total Utilities (Single Person): The average utility bill (electricity, heating, water, garbage) for a single person is slightly higher in Edmonton (~$127/month$) compared to Calgary (~$114/month$). This difference is minor compared to housing.
    • Seasonal Variation: As Edmonton is further north and tends to have colder, longer winters, residents may see higher natural gas usage and heating costs in the deepest winter months, although this is marginal.

    4.2 Water and Waste Management

    Municipal water and waste fees are set locally. Edmonton (EPCOR) and Calgary (ENMAX) structure their rates differently, but overall, these essential services are comparable and do not represent a major cost differentiator.

    4.3 Internet and Communications

    Since major providers like Telus and Rogers/Shaw operate across both CMAs, there is negligible difference in the price of broadband internet or mobile phone plans. Any price variation is typically due to local promotional offers rather than structural costs.

    5. Transportation Costs

    Transportation costs depend heavily on whether a resident relies on public transit or private vehicle ownership.

    5.1 Public Transportation

    Edmonton offers a measurable cost advantage for the daily commuter.

    5.1.1 Transit Systems Overview

    • Calgary Transit: Operates the CTrain (light rail) and extensive bus network.
    • Edmonton Transit Service (ETS): Operates the LRT and bus network, with the LRT undergoing significant expansion.

    5.1.2 Fare Structures

    • Calgary Adult Monthly Pass: $115.00
    • Edmonton Adult Monthly Pass (Arc Card Cap): $102.00

    Edmonton’s monthly transit cost saves a regular commuter $13.00 per month, or $156.00 annually. Both cities offer comprehensive low-income passes based on a sliding scale.

    5.1.3 Coverage and Convenience

    Calgary’s CTrain covers major corridors efficiently, while Edmonton’s LRT continues to expand. Commute times in both cities average around 27 minutes, which is generally efficient compared to major cities like Toronto or Vancouver.

    5.2 Vehicle Ownership Costs

    5.2.1 Insurance

    Auto insurance is a major expense in Alberta, and premiums are highly personalized (driving history, vehicle type). However, city-level statistics suggest that Calgary has slightly higher average auto insurance premiums due to higher population density, traffic congestion, and a higher rate of severe accidents or theft in certain areas.

    While province-wide averages are around $2,647 annually, specific city-level comparisons often show Calgary’s rates are marginally higher than Edmonton’s. This is a small, but persistent, cost factor in favor of Edmonton.

    5.2.2 Fuel Prices

    Fuel prices are volatile and regulated provincially, leading to minimal consistent price differences between Calgary and Edmonton, though local gas price wars can cause temporary variations.

    6. Food and Groceries

    The cost of food and household consumables is extremely close between the two cities.

    6.1 Grocery Store Prices

    Crowdsourced data (like Numbeo) indicates that consumer prices excluding rent are very comparable, with one analysis suggesting they are 0.37% higher in Edmonton. Major national grocery chains (Superstore, Sobeys, Safeway) maintain similar price points across the province.

    6.2 Dining Out

    Calgary is sometimes cited as having slightly lower overall restaurant prices compared to other large Canadian cities, though data comparing the two Alberta cities often shows minimal difference. Both cities have vibrant culinary scenes.

    7. Healthcare and Medical Expenses

    As a key benefit of living in Alberta, residents in both Calgary and Edmonton are covered by the Alberta Health Care Insurance Plan (AHCIP), which covers most essential services (doctors, hospitals, medically necessary care).

    7.1 Provincial Healthcare Coverage

    AHCIP is consistent across the province. Out-of-pocket costs arise from:

    • Dental Care: Routine adult dental care is not covered. Costs are governed by the Alberta Dental Fee Guide, making expected expense levels identical in both cities.
    • Vision Care: Eye exams for working-age adults (19-64) are typically not covered, requiring private payment.

    7.2 Healthcare Accessibility

    Quality of life is impacted by accessibility. Data from Alberta Health Services (AHS) can be used to compare emergency room wait times and specialist availability between the Calgary Zone and the Edmonton Zone, which is a non-monetary cost that can vary seasonally.

    8. Childcare and Education

    The cost of raising a family is impacted by childcare, K-12 fees, and post-secondary tuition.

    8.1 Childcare Costs

    The most significant change in this category is the provincial/federal push for the $10-a-day childcare program.

    • Provincial Subsidy: The Affordability Grant and Subsidies are standardized across Alberta, minimizing major cost differences between Calgary and Edmonton childcare centers.
    • Final Parental Fee: Any remaining difference in the final fee paid by the parent reflects a marginal variation in the local operator’s base costs (e.g., rent for the facility, which may be lower in Edmonton).

    8.2 K-12 Education

    Public and Catholic school systems (CBE/CCSD in Calgary, EPS/ECS in Edmonton) provide K-12 education for free. However, non-instructional fees for transportation (school busing) or specialized programs can vary slightly between the municipal school boards.

    8.3 Post-Secondary Education

    Tuition rates for common programs at the University of Calgary (U of C) and the University of Alberta (U of A) are generally competitive and comparable, with minor differences based on fee structures. Student living costs are again subject to the housing differential, making student life generally cheaper in Edmonton.

    9. Entertainment and Lifestyle

    Both cities offer rich entertainment options, with costs closely aligning with national averages.

    9.1 Recreation and Fitness

    Gym memberships and recreation center access fees are comparable. Edmonton benefits from the massive River Valley system offering free, expansive outdoor recreation, while Calgary is minutes away from the Rocky Mountains, offering a premium on accessibility to high-altitude outdoor pursuits (hiking, skiing).

    9.2 Cultural Activities

    The costs for movies, museums, and performing arts tickets are similar. Edmonton’s reputation as “Festival City” may mean residents spend slightly more on seasonal festival attendance, while Calgary’s cultural spending may skew toward major events like the Stampede and high-profile sporting events.

    9.3 Shopping and Retail

    Alberta has no Provincial Sales Tax (PST). Residents in both cities pay only the 5% Federal Goods and Services Tax (GST). This provides an advantage over residents of most other Canadian provinces.

    10. Taxes and Government Fees

    10.1 Provincial Income Tax

    Alberta has a progressive income tax system with some of the lowest overall rates in Canada, providing higher disposable income for all Albertans compared to similar income levels in most other provinces. This tax system is identical for residents of both Calgary and Edmonton.

    10.2 Municipal Property Taxes

    As noted in Section 3.3, this is a significant differentiator for homeowners.

    • Calgary: Lower mill rate, but higher property values.
    • Edmonton: Higher mill rate, but lower property values.

    For two identical-looking homes, the one in Edmonton will likely be cheaper to buy but incur a higher property tax burden if the assessment value is the same. However, given Calgary’s vastly higher benchmark prices, the actual dollar amount paid on property tax may still be higher in Calgary simply because the average assessed value is so much greater.

    11. Employment and Income Considerations

    The choice between the two cities often comes down to the earning potential, which is structurally higher in Calgary.

    11.1 Average Salaries and Wages

    11.1.1 By Occupation Level and Industry

    Calgary’s median income is generally higher than Edmonton’s, reflecting its status as a major corporate, financial, and O&G headquarters.

    • Calgary Median Income: $63,700
    • Edmonton Median Income: $57,000

    This 12% difference in median income is crucial. Higher salaries in Calgary’s concentrated finance and tech sectors are often necessary to absorb the city’s higher housing costs. Edmonton’s strongest sectors—public administration, education, and manufacturing—offer greater job stability but typically come with lower wage ceilings.

    11.2 Job Market Comparison

    In 2024, both CMAs experienced healthy job growth, with unemployment rates around 5.5%.

    • Calgary: Focused on high-growth, high-paying jobs in the tech and corporate sectors, driven by significant venture capital investment and business expansion (as highlighted by CED and AEC reports).
    • Edmonton: Driven by stable, large-scale public sector employment and institutional strength (Government, U of A).

    12. Special Considerations for Different Groups

    12.1 For Business Owners and Investors

    • Commercial Real Estate: Edmonton generally offers a lower cost for commercial office and industrial space, making it potentially cheaper to start a new business or expand existing operations. This lower cost of doing business (supported by Edmonton Global’s emphasis on competitive cost advantage) can translate into higher profit margins or lower consumer prices.
    • Talent Pool: Calgary offers a deeper pool of talent in finance, sales, and corporate services, while Edmonton excels in manufacturing, AI, and public policy expertise.
    • As you currently reside in Australia with an Alberta incorporation, the commercial rent advantage in Edmonton may be a significant factor when deciding on a physical head office location within the province.

    12.2 For Families

    Edmonton’s lower home and rental prices make it drastically easier for families to enter the housing market or afford a larger home. This advantage can free up hundreds of dollars monthly for family expenses, offsetting Calgary’s marginal income advantage for many middle-class families.

    13. Quality of Life Factors Beyond Cost

    The true “cost” of living also includes what you gain (or lose) in quality of life.

    13.1 Weather and Climate

    Edmonton is consistently colder in the winter than Calgary, experiencing longer periods of extreme cold, which can contribute to slightly higher winter heating costs and greater dependence on private vehicle ownership during cold snaps. Calgary benefits from the Chinook winds, which bring periodic warm breaks to the winter.

    13.2 Safety and Crime Rates

    While both cities are generally safe, objective data from Statistics Canada’s Crime Severity Index (CSI) can be used to compare the volume and severity of police-reported crime, which impacts home and auto insurance rates and neighborhood perception.

    13.3 Green Spaces and Environment

    Edmonton boasts the largest urban parkland in North America, the River Valley, offering massive year-round recreational access. Calgary’s proximity to the Rocky Mountains (less than an hour’s drive) is its unparalleled environmental advantage.

    14. Total Cost of Living Comparison

    14.1 Monthly Budget Breakdowns

    CategorySingle Professional (Calgary)Single Professional (Edmonton)Difference
    Housing (1-BR Rent)$1,613$1,339+$274
    Utilities (Est.)$114$127-$13
    Food/Groceries (Est.)$554$531+$23
    Transportation (Transit Pass)$115$102+$13
    Total CoL (Excl. Insurance/Discretionary)~$2,396~$2,109Calgary is ~$287 higher

    The base cost of living is consistently higher in Calgary, driven almost entirely by the housing market.

    14.2 Purchasing Power Analysis

    The final calculation of purchasing power requires balancing the higher costs in Calgary against its higher median income.

    • Calgary Advantage: If a professional in Calgary earns $10,000 more annually than a counterpart in Edmonton, this $833/month advantage easily covers the ~$287$ higher monthly cost of living, leaving significantly more disposable income for savings or discretionary spending.
    • Edmonton Advantage: If the salary difference for a given job role is small or non-existent (e.g., public sector jobs), Edmonton’s lower CoL translates directly into superior disposable income and saving potential.

    15. Pros and Cons Summary

    CityAdvantagesDisadvantages
    CalgaryHighest median salary in Canada, Corporate/Finance/Tech career hub, Rapid job growth, Proximity to the Rockies, Lower property tax mill rate.Significantly higher housing costs (rent and purchase), Tighter housing market (difficult to buy), Higher overall cost of living index.
    EdmontonSignificantly lower housing costs (purchase and rent), Stable job market (Government, Public Sector), Lower commuter costs, Excellent cultural/festival scene, Lower cost of business for commercial properties.Lower overall median salary, Higher property tax mill rate, Colder and longer winters, Market less focused on corporate HQs.

    16. Decision-Making Framework

    Making the final choice requires isolating the one most important financial variable for your situation:

    1. If You Must Buy a Home Today: Choose Edmonton. The ~$200,000$ difference in detached home prices creates a virtually insurmountable cost advantage for the capital city.
    2. If You Work in a High-Earning, Corporate Role: Choose Calgary. If your specific industry salary premium in Calgary is greater than 12% over the Edmonton equivalent, the higher disposable income will outweigh the increased cost of living.
    3. If You Value Monthly Cash Flow and Stability: Choose Edmonton. The lower baseline housing and transportation costs offer a superior saving potential for individuals and families in non-executive or public sector roles.

    17. Practical Tips for Newcomers

    • Moving Costs: Both cities have a comparable initial setup cost. For those moving internationally, remember Alberta is a low-tax environment, which can lower the cost of purchasing large items like furniture and appliances compared to provinces with PST.
    • Money-Saving Strategy: In Calgary, prioritize renting and maximize income. Focus on job quality and salary growth. In Edmonton, prioritize immediate homeownership. Leverage the lower prices to build equity quickly, which is the fastest way to lock in long-term savings.

    18. Conclusion

    18.1 Final Verdict: Which City is More Affordable?

    The overall cost winner, based on raw numbers and the single largest expense, is definitively Edmonton. The capital city’s ability to offer a lower entry point into both the rental and homeownership markets makes it the financially superior choice for most residents, particularly first-time buyers and young families.

    18.2 Beyond the Numbers

    However, this verdict comes with critical nuance. Calgary is the more profitable city for high earners. For a skilled professional in technology or corporate finance, Calgary’s superior income prospects can translate into a higher disposable income, despite the higher cost of living. The choice is less about which city is cheaper, and more about which city provides the best Value-to-Income Ratio for your specific career path.

    18.3 Next Steps

    For investors and business owners, the next logical step is to analyze the commercial property and talent acquisition costs for your specific sector (e.g., is your tech talent cheaper to acquire in Edmonton, or is the corporate infrastructure of Calgary essential?). For potential residents, compare the median salary for your specific occupation in both CMAs to quantify your personal purchasing power advantage.

    19. Key Data Sources

    This document lists the primary official and industry sources used to compile the comparative data and analysis in the “Cost of Living in Calgary vs Edmonton, Canada” article.

    19.1 Housing and Real Estate

    Housing is the largest cost variable between the two cities; these sources provide the benchmark prices and rental costs.

    Source TitleInformation Provided
    Canadian Real Estate Association (CREA)MLS® Home Price Index (HPI) for Calgary and Edmonton, providing benchmark home purchase prices for detached, attached, and condo properties.
    Rentals.ca/Urbanation ReportsAverage monthly asking prices for vacant 1-bedroom and 2-bedroom rental units in the Calgary and Edmonton CMAs.
    Canada Mortgage and Housing Corporation (CMHC)Rental Market Survey data (vacancy rates, average rents for occupied units) and Housing Starts data (used for market trends).

    19.2 Employment, Income, and Taxes

    These sources establish the differences in earning potential and the primary tax burdens for residents and businesses.

    Source TitleInformation Provided
    Statistics Canada (StatCan)Median income (city-wide), unemployment rates, and broader labour force data for the CMAs.
    Job Bank (Government of Canada)Wages and Salary reports by occupation and geographic region, used for comparing specific job salaries.
    City of Calgary / City of EdmontonResidential property tax rates (mill rates) and assessment tools.
    Government of Alberta (Taxes)Official personal and corporate income tax brackets and rates.

    19.3 Utilities, Services, and Transportation

    This data confirms the cost of daily living, covering fixed charges and public transit.

    Source TitleInformation Provided
    Utilities Consumer Advocate (UCA)Tools for comparing competitive energy (electricity and natural gas) commodity rates and understanding local distribution charges.
    Calgary Transit / Edmonton Transit Service (ETS)Official fare structures, including the Adult Monthly Pass ($115.00) and the Arc Card Monthly Fare Cap ($102.00).
    Alberta Auto Insurance Rate Board (AIRB)Reports on provincial auto insurance rate trends and contributing factors (city-level comparison).

    19.4 Healthcare, Education, and Quality of Life

    These sources address key family and long-term costs, as well as non-monetary quality of life metrics.

    Source TitleInformation Provided
    Government of Alberta – Child CareInformation on the standardized, provincial Affordability Grant and Subsidy amounts for childcare.
    Alberta Health Services (AHS)Reports on Emergency Department and surgical wait times for the Calgary Zone and Edmonton Zone.
    University of Calgary / University of AlbertaPublished domestic tuition and mandatory fee schedules for common programs.
    Statistics Canada (CSI)Police-reported Crime Severity Index (CSI) for objective safety comparisons.
    Calgary Economic Development (CED)Economic Outlooks, business composition, and talent pool insights (used for investor/business analysis).

    19.5 Indexed Data (Consumer Perspective)

    These crowd-sourced or institutional indexes provide a holistic, real-time consumer perspective on cost parity.

    Source TitleInformation Provided
    Numbeo / ExpatistanCrowdsourced Cost of Living Index (excluding rent) for everyday expenses like groceries, restaurant meals, and personal care items.
    The Conference Board of CanadaInstitutional economic forecasts and research on factors like affordability and job growth sustainability.