Posted inArticles Energy & Commodities
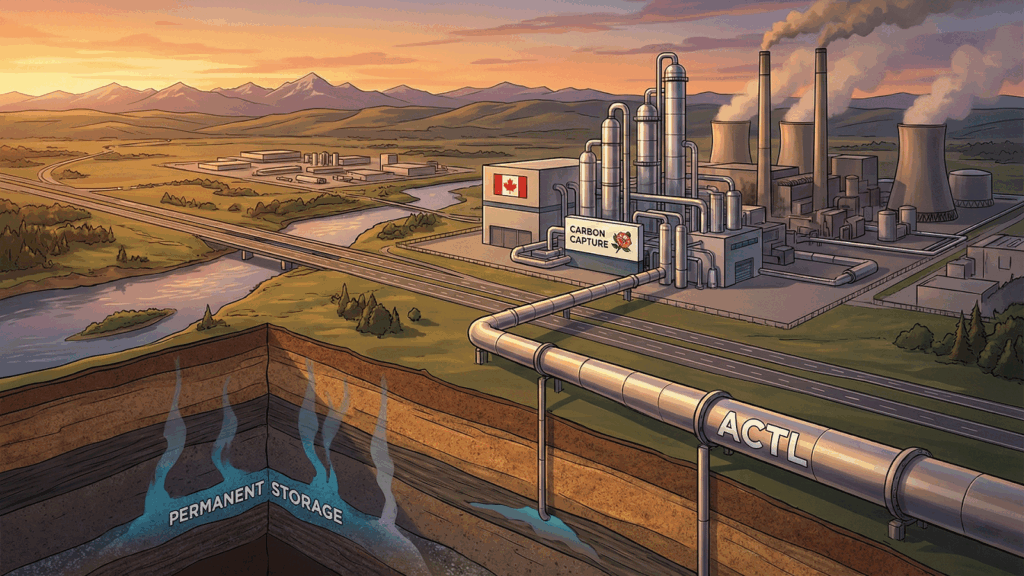
CCUS in Action: From Theory to Reality with Alberta’s Trunk Line and Hubs
Alberta, with its vast geological capacity and deep expertise in energy development, is globally recognized as a pioneer in the practical, commercial-scale deployment of Carbon Capture, Utilization, and Storage (CCUS).…