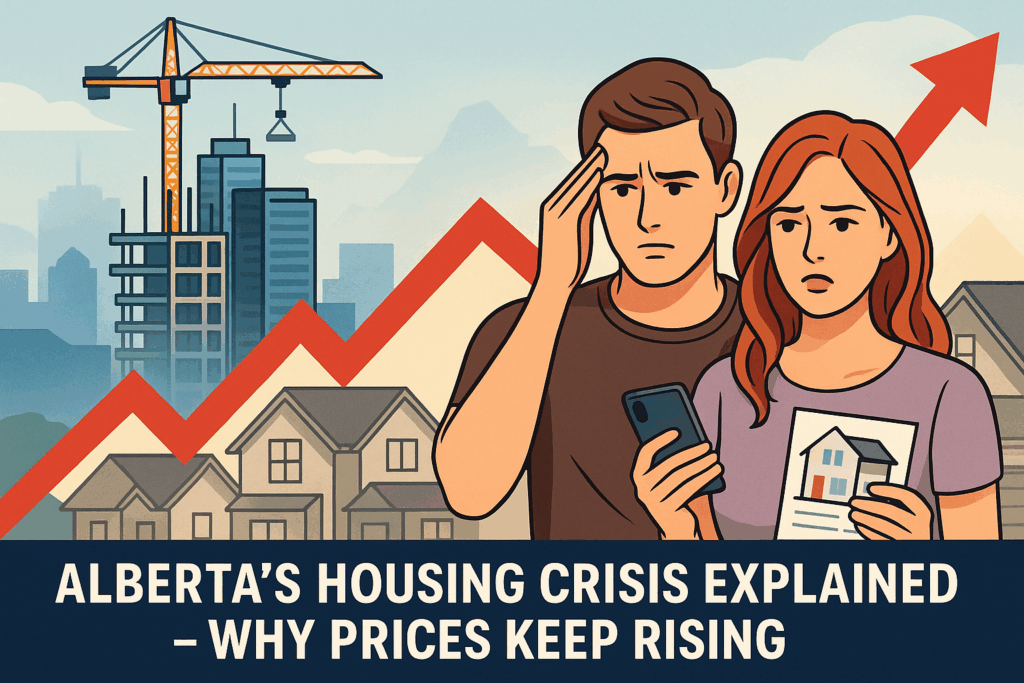
Negative Equity: The New Reality for 2026 Homeowners
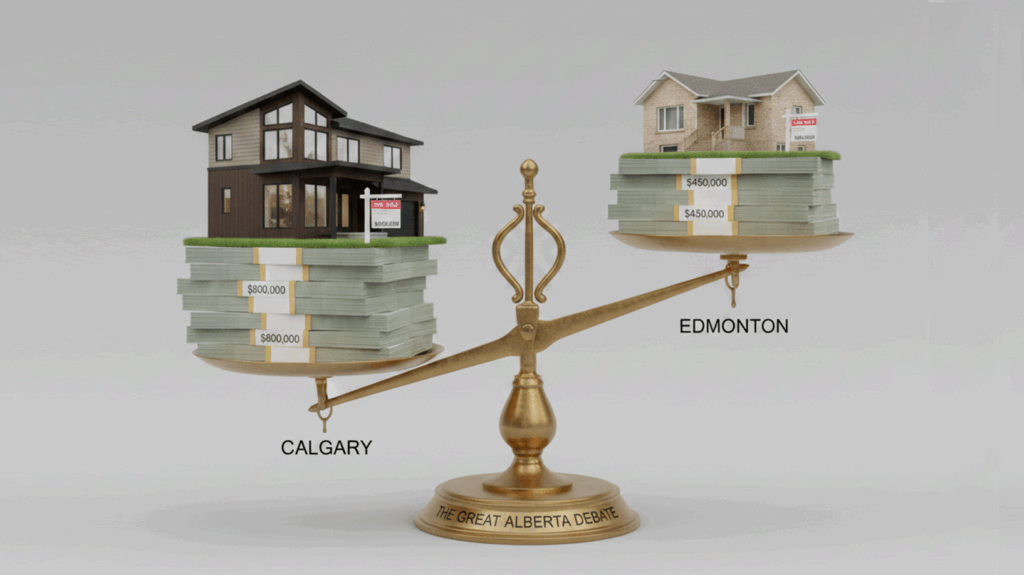
The Alberta real estate landscape, long characterized by its "boom and bust" cycles, has entered a sophisticated and challenging new chapter. As we navigate the mid-point of 2026, the exuberant…