For over a century, the city of Medicine Hat, Alberta, has been affectionately and economically known as “The Gas City.” Famously described by author Rudyard Kipling as having “all hell for a basement,” the municipality sits atop vast natural gas reserves that have historically powered an independent, municipally owned utility model entirely unique in the province. However, as the global energy transition accelerates and the economics of power generation evolve, this historic city is looking upward, pivoting from the subterranean gas fields to the abundant sunshine of southeastern Alberta. At the center of this pivot is the proposed Saamis Solar Park, a massive undertaking that represents both a triumph of municipal ambition and a complex case study in modern energy economics.
Yet, this transition is not without its friction. The development of the Saamis project has triggered a fascinating “policy collision” between localized municipal energy goals and the overarching mandates of provincial grid stability. As investors, engineers, and policymakers look to Alberta as a deregulated energy frontier, understanding the mechanics of this stand-off is crucial. This article provides a comprehensive, educational breakdown of the Saamis Solar project, the technical realities of grid interconnection, the financial modeling behind utility-scale solar Return on Investment (ROI), and the regulatory frameworks governing Alberta’s electrical future.
The following economic facts are based on current Alberta provincial data and market trends.
Historical Context: The Economics of The Gas City’s Transition
To understand the magnitude of the Saamis Solar project, one must first understand the unique economic machinery of Medicine Hat. Unlike almost every other municipality in Alberta, which relies on private utility providers operating within the Alberta Electric System Operator (AESO) grid, Medicine Hat owns its own electric generation, transmission, and distribution utilities.
The Municipal Advantage
Historically, this model provided the city with a distinct economic moat. By extracting its own natural gas and burning it in city-owned power plants, Medicine Hat could offer its residents and industrial businesses highly competitive, insulated energy rates. This vertical integration created a reliable revenue stream that subsidized municipal taxes and funded public services, making the city highly attractive to specific industrial investments.
However, the foundational economics of this model have shifted dramatically over the past decade due to several converging factors:
- Depleting Legacy Reserves: The easily accessible, low-cost natural gas reserves directly beneath the city have matured, increasing the marginal cost of extraction.
- Carbon Pricing Mechanics: The implementation of the provincial Technology Innovation and Emissions Reduction (TIER) regulation, alongside federal carbon pricing mandates, has introduced a rising operational expenditure (OpEx) for every megawatt-hour (MWh) of electricity generated via fossil fuels.
- The Plunge in Renewable CapEx: The global supply chain has driven the Capital Expenditure (CapEx) of photovoltaic (PV) solar panels and inverters down by over eighty percent over the last decade, fundamentally altering the Levelized Cost of Energy (LCOE) equation.
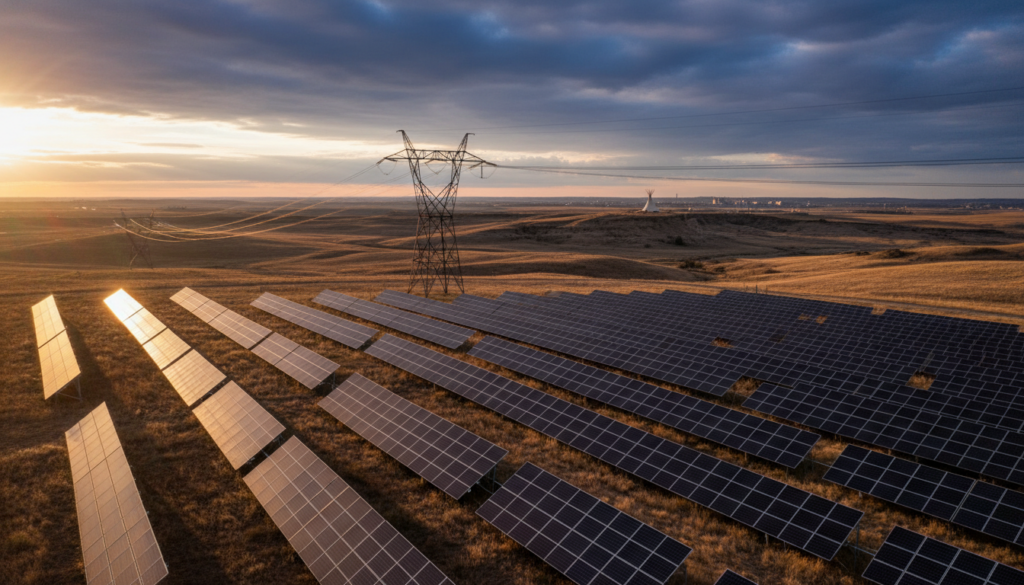
Faced with these realities, Medicine Hat’s municipal planners recognized that maintaining their economic moat required diversifying their generation portfolio. Southeastern Alberta boasts some of the highest solar irradiance levels in Canada, making utility-scale solar a mathematically logical step.
Anatomy of a Megaproject: The Saamis Solar Park
The Saamis Solar Park is not merely a municipal pilot project; it is a utility-scale megaproject designed to fundamentally alter the regional generation mix. Proposed by the DP Energy group and Irish developer Saamis Solar, the project requires a meticulous educational breakdown to understand its scale and economic intent.
Technical Specifications and Land Use Strategy
The project is designed with a massive nameplate capacity of 325 megawatts (MW). To put this into perspective, 325 MW of peak solar generation is theoretically enough to power over two hundred and fifty thousand homes under optimal conditions, far exceeding the baseline residential demand of Medicine Hat itself.
One of the most educational aspects of the Saamis project is its approach to land use. Rather than consuming prime agricultural land—a major point of contention in Alberta’s renewable sector—the Saamis project is strategically sited on approximately 1,600 acres of brownfield land. Specifically, a significant portion of the array is designed to sit atop a phosphogypsum stack, a byproduct storage site from a legacy fertilizer manufacturing plant.
The Economics of Brownfield Development:
- Land Valuation: Brownfield sites carry minimal opportunity cost. They cannot be used for residential zoning or agriculture due to environmental contamination, driving the lease or purchase costs down significantly compared to arable land.
- Environmental Permitting: While building on a contaminated site requires specialized engineering (such as non-penetrating ballasted mounting systems for the solar panels to avoid disturbing the toxic stack), it aligns perfectly with environmental reclamation goals, often streamlining specific regulatory approvals.
- Proximity to Infrastructure: Legacy industrial sites typically have existing, robust transmission infrastructure nearby, theoretically reducing the capital required for interconnection facilities.
Capital Expenditure (CapEx) Breakdown
The estimated capital cost for the Saamis project is cited at approximately $131.5 million. For financial analysts and engineers, breaking down this CapEx is essential for understanding utility-scale solar economics. At $131.5 million for 325 MW, the project is coming in at roughly $0.40 per watt of capacity.
This highly competitive capital cost is achieved through economies of scale. The CapEx is generally distributed across the following categories:
- Modules (Panels): Approximately forty to forty-five percent of the total cost. The utilization of high-efficiency bifacial modules (which capture reflected light from the ground) maximizes yield.
- Inverters and Balance of System (BoS): Approximately twenty percent. This includes the massive central inverters required to convert the Direct Current (DC) generated by the panels into the Alternating Current (AC) required by the grid.
- Structural and Civil Engineering: Approximately fifteen percent, though potentially higher here due to the specialized ballasted mounts required for the phosphogypsum stack.
- Interconnection and Substation: Approximately ten percent, covering the transformers and switchgear to step up the voltage for grid transmission.
- Soft Costs: Approximately ten percent, covering engineering, procurement, construction management (EPCM), legal, and regulatory compliance.
Evaluating the ROI: The Financial Mathematics of Solar in Alberta
To understand why a $131.5 million investment makes sense, we must look at the mathematical mechanics of Return on Investment (ROI) in Alberta’s deregulated electricity market. Unlike other jurisdictions with fixed feed-in tariffs, Alberta operates an energy-only market where electricity is traded as a commodity, and prices fluctuate based on real-time supply and demand.
The Revenue Equation
The ROI for the Saamis project relies on two primary revenue streams: Wholesale Energy Sales and Environmental Attributes.
1. Wholesale Energy Sales (The Pool Price) Alberta’s wholesale electricity price, known as the Pool Price, settles every hour. Solar projects generate maximum power during daylight hours. Historically, daylight hours correlated with high commercial and industrial demand, leading to strong pricing.
However, investors must calculate the “Capture Price”—the actual average price the solar farm receives when it is generating, which is often lower than the 24-hour average pool price due to the “duck curve” effect (where abundant solar generation in the middle of the day drives the hourly price down).
2. Environmental Attributes (TIER Credits) Because solar generation creates zero emissions, the facility generates carbon offset credits under Alberta’s TIER regulation. Facilities that emit carbon above baseline allowances must purchase these credits. As the federal price on carbon escalates toward $170 per tonne by 2030, the value of these TIER credits provides a highly lucrative, secondary revenue stream that fundamentally underpins the ROI of renewable megaprojects.
The Capacity Factor Variable
When calculating ROI, engineers use a metric called the “Capacity Factor.” A 325 MW solar farm does not produce 325 MW continuously. Nighttime, winter weather, and cloud cover reduce output. In southeastern Alberta, a well-designed single-axis tracking or optimized fixed-tilt solar farm typically models a capacity factor of roughly twenty-two to twenty-four percent.
Simplified Annual Revenue Model:
- Nameplate Capacity: 325 MW
- Annual Hours: 8,760 hours
- Capacity Factor: 23%
- Estimated Annual Generation: 325 MW x 8,760 hours x 0.23 = 654,810 MWh
If we assume a conservative blended revenue rate (Capture Price + TIER Credit value) of $80 per MWh, the facility could theoretically generate over $52 million in gross annual revenue.
Operational Expenditure (OpEx) and Payback Period
Utility-scale solar boasts incredibly low OpEx compared to thermal generation. There are no fuel costs. The primary ongoing expenses are:
- Operations and Maintenance (O&M) contracts (panel washing, inverter servicing).
- Land lease agreements.
- Insurance and property taxes.
- Municipal interconnection tariffs.
Assuming an annual OpEx of $5 million, the Net Operating Income (NOI) sits at $47 million. Against a $131.5 million CapEx, the simple payback period is remarkably short—under three to four years, assuming stable capture prices. This robust financial math is exactly why municipal and private capital is eager to deploy into these assets.
The Policy Collision: Municipal Ambition vs. Provincial Mandates
If the financial math is so compelling, why is the Saamis project characterized as a stand-off? The answer lies in the structural friction between local economic development and macro-level grid management. This is the “Policy Collision.”
In recent years, the rapid proliferation of wind and solar projects in Alberta created unexpected operational challenges for the provincial government and the AESO. In response, the Alberta government enacted a temporary, highly publicized moratorium on renewable energy approvals, followed by a suite of strict new regulatory frameworks.
The Provincial Perspective: Reliability and Agriculture
From the perspective of provincial policymakers, the grid must adhere to three foundational pillars: Affordability, Sustainability, and crucially, Reliability.
The new provincial rules mandate strict “Agriculture First” policies, prohibiting renewable development on Class 1 and 2 agricultural lands unless combined with agrivoltaics (co-locating farming and solar). Furthermore, the province instituted mandatory visual impact assessments (protecting pristine viewscapes) and stringent reclamation bond requirements, ensuring developers pay upfront for the eventual decommissioning of the assets so the financial burden does not fall on taxpayers.
While the Saamis project cleverly bypasses the agricultural land debate by utilizing a brownfield phosphogypsum stack, it still found itself caught in the regulatory crossfire of the broader policy shift. The stand-off represents a philosophical debate: Should a municipality with its own historical utility rights be subjected to the same sweeping provincial pauses designed to manage private developers in other counties?
The AESO Mandate: Managing an Intermittent Grid
Beyond political policy, the true stand-off is rooted in physics and grid management. The AESO is legally responsible for keeping the lights on across Alberta. Integrating a massive 325 MW intermittent generation source into a specific node of the grid requires rigorous engineering studies.
The AESO must evaluate how the sudden influx of solar power at noon, and the sudden drop-off at sunset, impacts the delicate balance of supply and demand. If a municipality builds massive generation assets without coordinating with the provincial transmission planner, it risks destabilizing regional voltage and frequency. This necessity for centralized grid planning directly collides with Medicine Hat’s historical autonomy, requiring a complex renegotiation of how the city interacts with the broader Alberta Interconnected Electric System (AIES).
Grid Constraints: The Physics of Interconnection
For electrical engineers and grid planners, the most critical educational aspect of the Saamis Solar project is the physical reality of interconnection. Generating electricity is only half the battle; transmitting it to load centers without melting wires or tripping breakers is the true challenge.
Thermal Limits and Transmission Congestion
Electricity must flow through transmission lines, which have strict physical limitations known as thermal limits. When too much power is pushed through a line, the physical resistance causes the wire to heat up, expand, and sag. If a line sags into a tree or structure, it causes a catastrophic fault.
Southeastern Alberta is currently experiencing severe transmission congestion. The region is blessed with the best solar and wind resources in the country, leading to a gold rush of renewable development. However, the physical “wires” connecting the southeast to the major load centers (Calgary and Edmonton) have not been upgraded at the same pace.
When the Saamis project generates 325 MW on a sunny day, it is competing for space on those transmission lines with dozens of other wind and solar farms in the region.
The Threat of Curtailment
When transmission lines reach their thermal limits, the AESO must intervene to protect the grid. They do this through a process called “curtailment.” The grid operator sends a digital signal to generators, legally forcing them to ramp down or completely shut off their output, regardless of how brightly the sun is shining.
For investors modeling ROI, curtailment is the ultimate risk factor. If a mathematical model assumes a twenty-three percent capacity factor, but the AESO curtails the plant for ten percent of its generating hours due to regional grid congestion, the revenue model collapses. The stand-off regarding Saamis involves detailed engineering debates over who pays for the necessary transmission upgrades to prevent this curtailment, and how much risk the municipal utility is willing to absorb.
Grid Inertia and Frequency Regulation
Another critical grid constraint is the loss of “inertia.” Historically, Alberta’s grid was powered by massive coal and natural gas turbines. These immense, heavy pieces of physical metal spin at exact speeds (synchronized to 60 Hertz). Because of their massive physical weight, they possess kinetic energy, or “inertia.” If a power plant trips offline, the physical momentum of these spinning turbines acts as a shock absorber, keeping the grid frequency stable for a few crucial seconds while backup generators fire up.
Solar panels have zero moving parts. They are purely solid-state electronics utilizing inverters. Therefore, they provide zero physical inertia to the grid. As Medicine Hat transitions away from spinning gas turbines toward the Saamis solar array, the regional grid loses local inertia. The AESO must mandate that new projects provide synthetic inertia or frequency response capabilities through advanced smart inverters, adding technical complexity and cost to the project’s CapEx.
The Missing Link: Battery Energy Storage Systems (BESS)
To resolve the stand-off between municipal solar ambitions and provincial grid constraints, technical analysts point to a crucial missing link in the initial phases of many utility-scale solar projects: Battery Energy Storage Systems (BESS).
Shifting the Generation Curve
As discussed, solar generation peaks at noon, creating the “duck curve” where energy prices plummet due to oversupply, and then spikes in the evening when the sun sets just as residential demand peaks.
By integrating a massive lithium-ion or flow battery system alongside the Saamis project, the utility could fundamentally alter its economic profile.
- Arbitrage: The battery absorbs the 325 MW of solar power during the middle of the day when wholesale prices are low (or even negative). It stores this energy and discharges it into the grid during the evening peak, capturing the highest possible pool price.
- Relieving Congestion: Instead of forcing power onto a congested transmission line at noon, risking curtailment, the battery holds the power locally, easing the strain on the AESO’s infrastructure.
- Ancillary Services: Modern BESS can respond to frequency deviations in milliseconds, providing the synthetic inertia the grid desperately needs and opening up a third revenue stream for the asset owners by selling “Operating Reserves” to the AESO.
While adding a BESS significantly increases the initial Capital Expenditure of a project, the educational consensus among grid planners is that standalone solar will become increasingly difficult to permit and profit from without attached storage. The evolution of projects like Saamis will likely necessitate hybrid models to satisfy both municipal ROI demands and provincial stability mandates.
Navigating the Future of Alberta’s Energy Mix
The Saamis Solar project in Medicine Hat is far more than just a large field of solar panels; it is a live, educational masterclass in the complexities of the modern energy transition. It highlights the profound economic opportunities available in Alberta’s deregulated market, where a well-structured $131.5 million investment can yield rapid returns through a combination of wholesale energy sales and environmental attributes.
Simultaneously, it exposes the deep, structural stand-offs that occur when localized economic ambitions collide with the physical and regulatory realities of macro-grid management. The transition of “The Gas City” toward the sun requires navigating transmission congestion, understanding the physics of grid inertia, and adapting to a rapidly shifting provincial policy landscape designed to protect agriculture and ensure reliability.
For investors, business owners, and technical engineers analyzing the Alberta economy, the lessons from Medicine Hat are clear. The future of energy development in the province will not belong simply to those who can build the cheapest generation assets. It will belong to those who can engineer sophisticated, integrated solutions—utilizing brownfield sites, deploying advanced inverter technologies, and incorporating battery storage—to deliver power that is not only clean and profitable, but fundamentally cooperative with the strict operational constraints of the Alberta grid.
Sources and References
- Alberta Electric System Operator (AESO): Data regarding grid interconnection protocols, thermal limits, curtailment risks, and the Alberta energy-only market structure.
- Government of Alberta: Policy documentation detailing the Technology Innovation and Emissions Reduction (TIER) regulation, the recent renewable energy development pause, and the subsequent “Agriculture First” and viewscape regulatory frameworks.
- City of Medicine Hat / COMCO: Historical municipal utility data and public statements regarding the transition of generation assets and the evaluation of the Saamis Solar project.
- Saamis Solar / DP Energy: Publicly available technical specifications, land use strategies (phosphogypsum stack utilization), and capacity estimations for the 325 MW development.